Measuring Dev Env Health with Honeycomb
A tour of the Tilt Honeycomb extension, how it scrapes data, and how you can collect your own metrics
If you work with containers, and you have friends who also work with containers, you probably already know that image build performance can vary WILDLY from machine to machine.
Here’s a recent conversation from the Tilt Dev slack channel:
Matt I think I’m up to 90 minutes of update-codegen wall time for the day, might have to actually look into what it’s doing
nick is it possible you’ve got docker cpu or memory very constrained? for me it’s about 60sec. curious how long it takes for @milas ?
Matt I had a vague memory of mounted volume performance being bad on macos and that was what made toast proto slow and had handwavily assumed that was the case here as well
milas I’m running it now and will see how long it takes - I’ve given Docker 4 cores + 6GB of RAM (I’ve got 6/16 physical on my MBP).
milas make update-codegen 1.37s user 0.62s system 0% cpu 4:55.05 total ~5 mins, which is what it’s been in the past
Sure, a build that varies between 60 seconds and 90 minutes is an outlier, but it’s not an uncommon outlier!
Many Tilt users start to worry about this: are people on the team seeing vastly different behavior from their dev environment? How can we catch this?
In this post, I’m going to share some examples of an approach that’s worked well for us: the health collector sidecar.
I’ll show you how to:
-
Scrape the Tilt API to collect the data points you need (e.g., Docker build time).
-
Send those data points to a remote monitoring service like Honeycomb.
-
Run the health collector as part of your dev env.
If you want an off-the-shelf collector, here’s a Tilt extension I wrote that sends Docker build metrics to Honeycomb:
It’s fairly straightforward. You can also use that code as an example to write your own collector.
Collecting the Data
When you’re running a Tilt env, the Tilt API server exposes objects, their specs, and their current statuses.
To see the full set of API objects, run:
tilt api-resources
The API Server Reference gives a complete specification of all the objects and their fields in the latest version.
For this example, we’re going to use the DockerImage API to read data
about Docker image builds.
$ tilt get dockerimages
NAME                       CREATED AT
tilt-site:tilt-site        2021-12-02T15:55:02Z
docs-site:docs-site        2021-12-02T15:55:02Z
blog-site:blog-site        2021-12-02T15:55:02Z
(Tilt names each image as resource-name:image-name.)
To see detailed info about the image build, use -o=json:
$ tilt get dockerimage tilt-site:tilt-site -o json
{
    ...
    "spec": {
        "context": "/home/nick/src/tilt.build",
        "dockerfileContents": "FROM tilt-site-base\nADD ./src .\nADD healthcheck.sh .\nENTRYPOINT bundle exec jekyll serve --trace --config _config.yml,_config-dev.yml\n",
        "ref": "tilt-site"
    },
    "status": {
        "completed": {
            "finishedAt": "2021-12-02T15:55:09.616393Z",
            "startedAt": "2021-12-02T15:55:07.823548Z"
        },
        "ref": "localhost:38335/tilt-site:tilt-dc466fb6b52fa055",
    ...
}
The image object publishes when it started and when it finished the build. You can even get fine-grained performance data about each stage of the image build, if you want to know which stage is the slowest. But for this simple example, we’re only going to collect the total build duration.
Here’s a little python code to collect the data:
# Report duration times for each completed Docker Image build.

# Fetch JSON representation of Docker Image status
docker_image_list_json = subprocess.check_output(['tilt', 'get', 'dockerimage', '-o=json'])
docker_image_list = json.loads(docker_image_list_json)
builds = sorted(docker_image_list.get('items', []), key=lambda item: item['metadata']['name'])
events = []
for build in builds:
  completed = build.get('status', {}).get('completed', None)
  if not completed:
    continue

  # Parse timestamps.
  start_time = datetime.datetime.strptime(completed['startedAt'], '%Y-%m-%dT%H:%M:%S.%fZ').replace(tzinfo=datetime.timezone.utc)
  end_time = datetime.datetime.strptime(completed['finishedAt'], '%Y-%m-%dT%H:%M:%S.%fZ').replace(tzinfo=datetime.timezone.utc)

  # Add events.
  events.append({
    'data': {
      'image_name': build['spec']['ref'],
      'duration_ms': int((end_time - start_time).total_seconds() * 1000),
      'kind': 'dockerimage',
    },
    'time': completed['startedAt'],
  })
Hooray! We have event data telling us how long each image build took.
Next we need to report it.
Reporting the Data
In this example, we’re going to use Honeycomb. Most observability services will work.
I chose Honeycomb for this example because:
1) The free plan is more than enough to handle the volume of data we want to send.
2) They have an ad-hoc Events API that makes it easy to get started with your own data collection.
Here’s what the reporting loop looks like:
import http.client as http_client
api_key = 'MY-HONEYCOMB-API-KEY'
dataset = 'MY-HONEYCOMB-DATASET'
while True:
  headers = {'X-Honeycomb-Team': api_key}

  events = collect_events() # ADD YOUR EVENT COLLECTION CODE HERE
  client = http_client.HTTPSConnection("api.honeycomb.io", timeout=2)
  client.request('POST', '/1/batch/%s' % dataset, body=json.dumps(events), headers=headers)
  client.getresponse()
  client.close()

  # Log every 60 seconds
  time.sleep(60)
You can also see the actual code in-use here.
We used the HTTP API directly here to make it easier to see the flow. The
Honeycomb SDK
libhoney is a
better choice for high-throughput event reporters (because it does more async
buffering). The Honeycomb buildevents
tool has nice ergonomics for
reporting traces of CI builds.
Running the Collector
Lastly, we need to run the collector.
In your Tiltfile, you can add new local servers to your dev env with a single function call:
local_resource(
  name='honeycomb-collector',
  labels=['honeycomb'],
  allow_parallel=True,
  deps=['./honeycomb-collector.py'],
  serve_cmd=['python3', './honeycomb-collector.py'])
For more info on the kinds of local servers you can run, see the Local Resource Guide.
Win!
I can see the different image build durations in my Honeycomb dashboard:
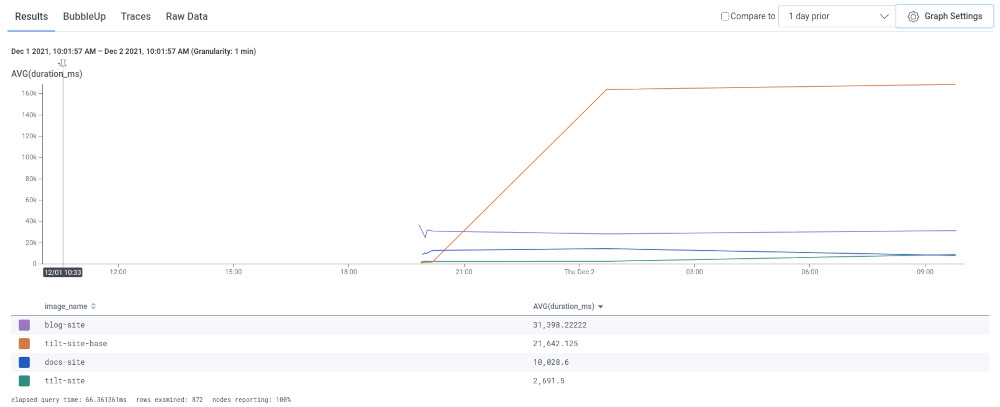
In a future post, I want to put togehter a more complex example that shows traces to visualize the different parts of your build. With the data in the Tilt API, we can break down a docker image build into its individual stages. Or we can show how the image build fits in relative to the rest of the dev env setup.
Thanks to Ian Smith at Honeycomb for sending me some code samples on the Events API that got me started with this! Also thanks to Ben Hartshorne at Honeycomb for reading a draft of this post.
Related
Rancher Desktop: Should You Use containerd Or dockerd?